- взЕЯЭиХрбЕ,зЈзЂгкЮЂВЈЁЂЩфЦЕЁЂЬьЯпЩшМЦЙЄГЬЪІЕФХрбј
ЪзвГ > AWR > AWRЙйЭјFAQ > Why Does FREQ 1 GHz Appear In Simulation Dialog For Oscillator Measurements
Why Does FREQ 1 GHz Appear In Simulation Dialog For Oscillator Measurements
ТМШыЃКedatop.com ЕуЛїЃК
Why does FREQ = 1 GHz appear in the Simulation dialog for oscillator measurements when my design oscillates at a frequency other than 1 GHz.
Measurements, such as Vtime, performed on schematics that use the OSCAPROBE element are unique because frequency is not swept and 1 GHz is always displayed. There are three possible places where this can be confusing:
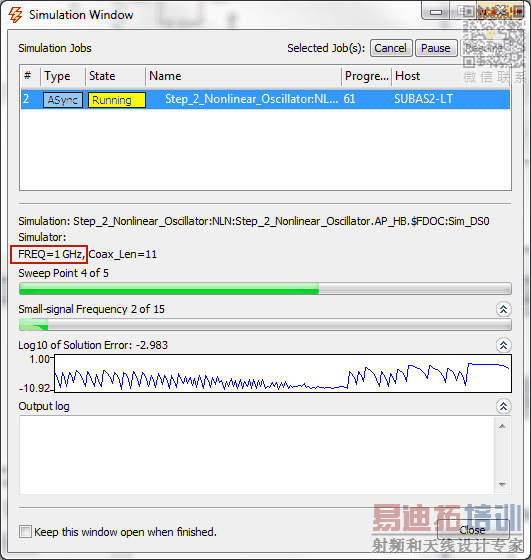
Simulation dialog for measurements on schematics with the OSCAPROBE element.
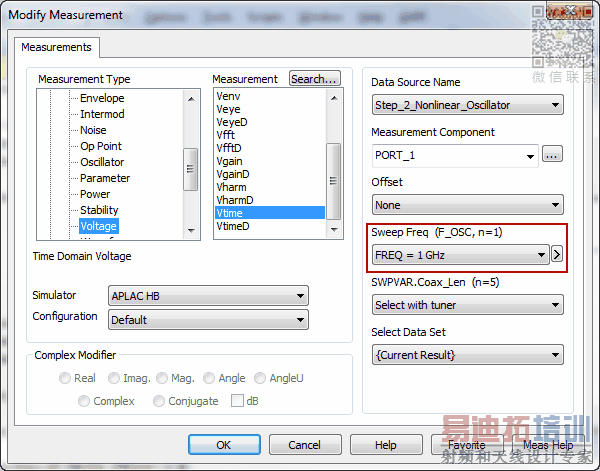
Measurement dialog for measurements on schematics with the OSCAPROBE element.
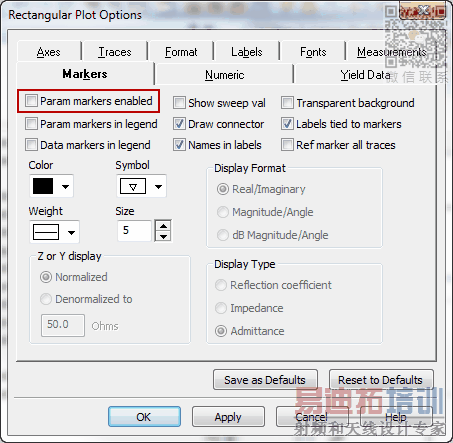
Parameter Markers on graphs which contain measurements on schematics with the OSCAPROBE element.
For each of these cases, you should ignore the FREQ = 1 GHz.
Notice that during simulation FREQ = 1 GHz appears, regardless of the actual frequency of oscillation for the circuit.
In the measurement dialog, notice that F_OSC is set to FREQ = 1 GHz and can not be changed.
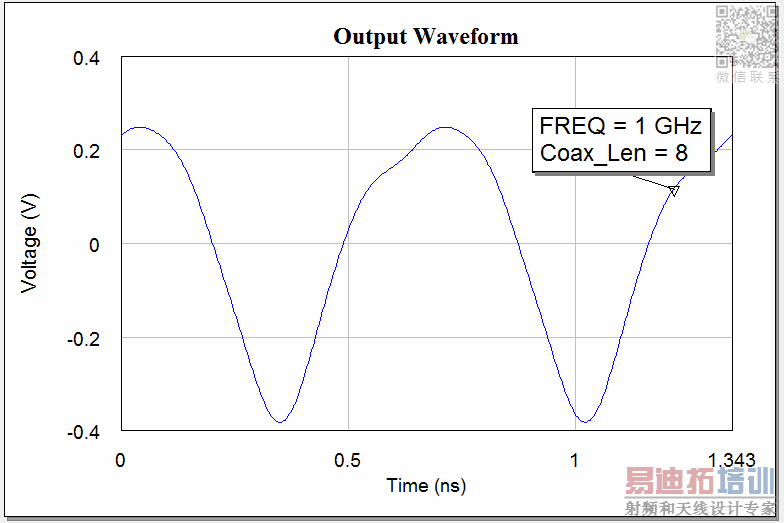
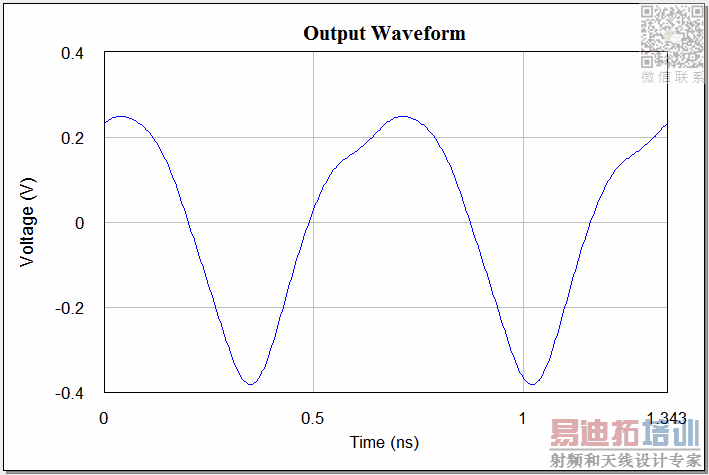
Another potential issue is the FREQ = 1 GHz marker that appears by default.
You can suppress this by right-clicking on the graph, selecting Markers tab, unchecking the box for Param markers enabled, and hitting Apply.
This should remove the parameter marker from view and the graph would appear like the one below.
For more information on how oscillators are simulated, see the Nonlinear Oscillator Analysis? section of the AWRDE Simulation and Analysis Guide.
AWR Microwave Office ХрбЕПЮГЬЬззАЃЌЪгЦЕНЬбЇЃЌАяжњФњПьЫйбЇЯАеЦЮеMWO...
ЩЯвЛЦЊЃКWhy does some part of my layout look dim when I print it out
ЯТвЛЦЊЃКWhy Can I Not Select a Ratline to Route an iNet
MWOХрбЕПЮГЬЭЦМіЯъЧщ>>
 Microwave officeзЈвЕЯЕЭГЕФЪгЦЕХрбЕЬззАЃЌАяжњФњДгСуПЊЪМЃЌШЋУцбЇЯАMWOЕФЩшМЦгІгУЁОMore..ЁП
CSTРИФП
ЦЕЕРзмХХаа
- Which CPW Line Models Support
- Problem Saving Layout Rulers in
- Calculate 3dB Bandwidth of Band
- AWR&'s GERBER File Format Details
- Using DXF Format with the AWR
- DXF Files Do Not Open in AutoCAD
- FAQ: Using Encrypted HSPICE Netlists
- Touchstone File Repair Utility
- How Can I Fix the Shorted Cir
- Failure initializing the AWR Sc