- 易迪拓培训,专注于微波、射频、天线设计工程师的培养
Why Eye diagram density goes to negative axis after channel?
录入:edatop.com 点击:
Hello,
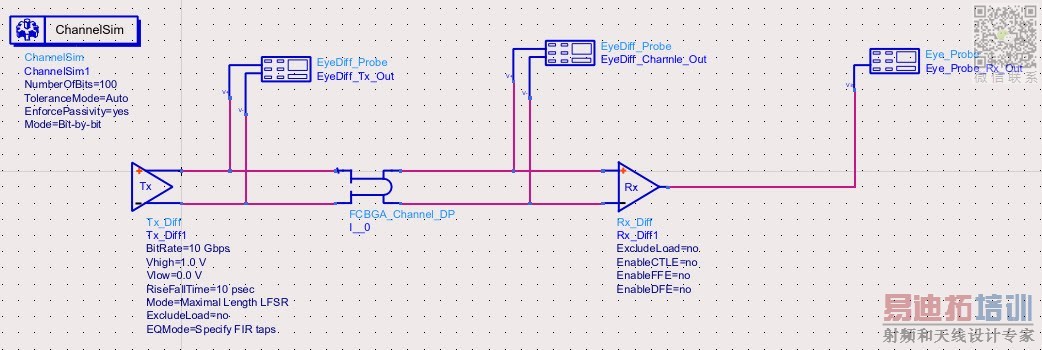
I have created a differential channel and was testing the channel with simple testbench to check the eye diagram. Now I know the channel performance is very bad (It of several PCB transmission lines, Via & Stubs, and Packaging model). But, I am curious while simulating channel performance, I get negative eye densitywhile checking the eye diagram after the channel which is for me unusual. My channel can be very bad as it is not well matched to 100 ohms. But keep those aside, how can an eye density be negative? what does that mean? If the channel is poor, the can be closed more which I know, but this thing is completely new to me. Can anyone explain why has it happened? I know I can improve it with an improved channel.
Testbench:
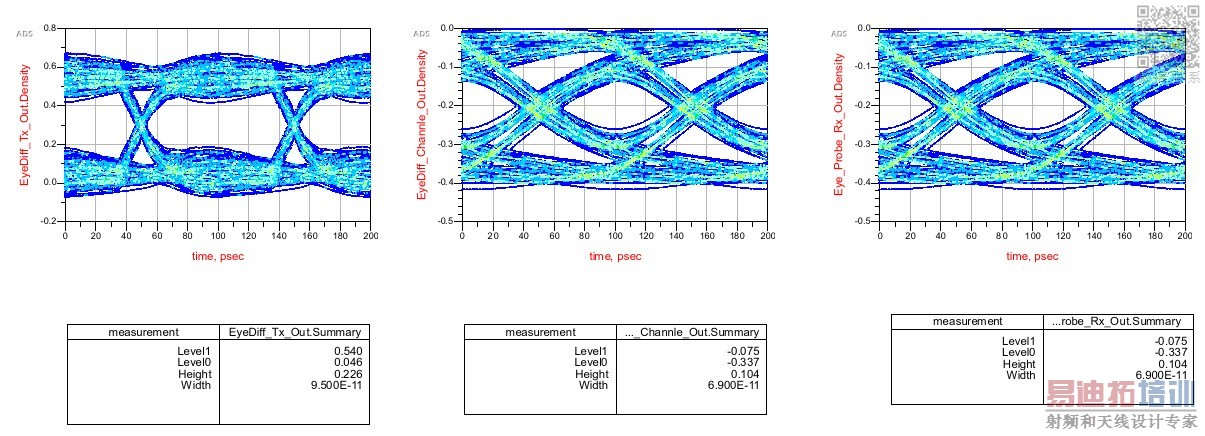
Eye plots:
Channel S-parameter Plot (Log):

Suggest viewing the waveform; if it has the same amplitude peaks, you can conclude that the density plot is correct.
(Waveform is an option on the Eye_Probe.)
申明:网友回复良莠不齐,仅供参考。如需专业帮助,请学习易迪拓培训专家讲授的ADS视频培训课程。
上一篇:How can I model a high conductance fast diode correctly in ADS?
下一篇:Extracting S-parameters of the Specific Test Frequency in matlab
ADS培训课程推荐详情>>
 国内最全面、最专业的Agilent ADS培训课程,可以帮助您从零开始,全面系统学习ADS设计应用【More..】
- Agilent ADS教学培训课程套装
- 两周学会ADS2011、ADS2013视频教程
- ADS2012、ADS2013射频电路设计详解
- ADS高低阻抗线微带滤波器设计培训教程
- ADS混频器仿真分析实例视频培训课程
- ADS Momentum电磁仿真设计视频课程
- ADS射频电路与通信系统设计高级培训
- ADS Layout和电磁仿真设计培训视频
- ADS Workspace and Simulators Training Course
- ADS Circuit Simulation Training Course
- ADS Layout and EM Simulation Training Course
- Agilent ADS 内部原版培训教材合集