- 易迪拓培训,专注于微波、射频、天线设计工程师的培养
CST2013: Time Signal Processing / Eye Diagram
录入:edatop.com 点击:
Home: Macros Macrosime Signal ProcessingEye Diagram
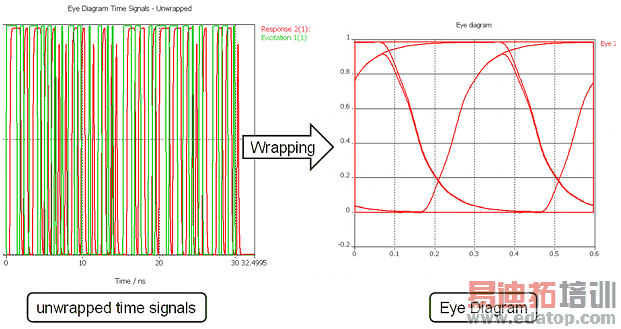
The macro generates the eye diagram for the current model, by using a bit sequence to drive the device. The output signal corresponding to this input is generated, and then a wrapping of the transmitted signal is performed in order to see the opening of the eye.
There are four main categories of user inputs:
- bit sequence
- pulse characteristics
- time step factor
- simulation type
Bit sequence options:
1) PRBS – pseudo-random bit sequence, generating a maximal length sequence based on special polynomials.
User input: order n. The resulting sequence has a length of 2^n-1 bits.
For some values of n, these polynomials are prescribed in norms (these are preferred in this implementation).
The so-called ”taps” of the polynomials are not user-editable in the current version.
2) Random – a random sequence of user-defined length. The bits are generated by using the built-in ”rnd” VBA command.
3) K28.5 – a standard bit sequence containing the symbols 11000001010011111010. Sometimes denoted by ”K28.5±”. The user can choose the initial, or the inverted sequence.
4) User defined – the user can input a sequence of 0 and 1 values.
Pulse characteristics
1) Rise and fall times – please note that these are the 0 – 100% rise/fall times, not the 10%-90% ones. The corresponding frequencies 1/rise_time and 1/fall_time are also displayed for information. For accurate results, these rise/fall frequencies should be smaller than the maximum frequency of the simulation frequency range.
2) Hold time
3) Amplitude; please note that bits go from 0 to 1*amplitude in the current version.
Time step factor
A smaller value for the time step factor provides a finer resolution of the calculated eye-output signal, but will slow down the computation. The default value 0.5 should be enough in most cases.
Simulation type
The user can choose among:
1) Using S-parameters (pre-calculated or not); especially for pre-calculated S-parameters, this is probably the quickest method.
2) Using directly time-domain calculation; this method can usually take much longer than the first; it is interesting for relatively short sequences, or if the problem is small.
The user can also choose the desired transmission path, by specifying the input and the output ports / modes.
Options for displaying the bit sequence characteristics
The following bit sequence characteristics can be displayed:
1) mark density [%]: number of ones / number of bits * 100
2) transition density [%]: number of transitions / number of bits * 100
3) maximum number of identical digits
4) mean:

5) standard deviation:

Another choice is to display the autocorrelation of the bit sequence, defined as:
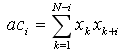
(The mean is not subtracted from the x values, there is no normalization performed.) Please note that only the values for i > 0 are displayed. The autocorrelation plot is stored under "1D ResultsBit sequences", together with the plot of the bit sequence itself.
After pressing OK, the output signal is generated and displayed. Then, a wrapping of the transmitted signal is performed in order to see the opening of the eye.
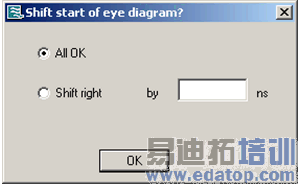
Finally, for better centering the eye diagram, you have the choice to shift the diagram to the right (on the time axis) by a desired amount.
OK
After pressing OK, the output signal is generated and displayed. Then, a wrapping of the transmitted signal is performed in order to see the opening of the eye.
Cancel
Closes this dialog box without performing any further action.
Help
Shows this help text.
CST微波工作室培训课程套装,专家讲解,视频教学,帮助您快速学习掌握CST设计应用
上一篇:CST2013: Template Based Post Processing
下一篇:CST2013: 3D Scalar Plot Special Settings
CST培训课程推荐详情>>
 最全面、最专业的CST微波工作室视频培训课程,可以帮助您从零开始,全面系统学习CST的设计应用【More..】
频道总排行
- CST2013: Mesh Problem Handling
- CST2013: Field Source Overview
- CST2013: Discrete Port Overview
- CST2013: Sources and Boundary C
- CST2013: Multipin Port Overview
- CST2013: Farfield Overview
- CST2013: Waveguide Port
- CST2013: Frequency Domain Solver
- CST2013: Import ODB++ Files
- CST2013: Settings for Floquet B