- 易迪拓培训,专注于微波、射频、天线设计工程师的培养
CST2013: Thermal Transient Result Overview
录入:edatop.com 点击:
The transient solver creates many 1D results and the start solution result automatically after the simulation process was finished. To get time-dependent temperature- or heat flow density-fields it is necessary to define field monitors before the solver is started.
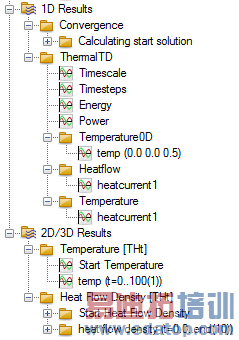
1D Results
Convergence
The convergence curve shows the residual of the linear or nonlinear solver versus iteration step for the computation of the start solution. The gradient of the curve indicates if the linear equation system is well conditioned or not. This curve is created automatically.
Timescale
This curve shows the current time for a given iteration step number. Integrating the "Timesteps" curve delivers the "Timescale" curve. This curve is created automatically.
Timesteps
This plot shows the time-step size versus the step number of the integration scheme. If the time step is small rapid transient changes are probably taking place - for instant if a source is steep ramped up with a time signal. This curve is created automatically.
Energy
During the simulation process the thermal energy inside all regions with a finite heat capacity is integrated and recorded.
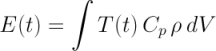
with:
E(t): time dependent energy
T(t): time dependent temperature
Cp: heat capacity
rho: density
dV: volume element
This curve is created automatically.
Power
This curve shows the total amount of power entering all regions with a finite heat capacity.

with:
Pstored: Power stored in the structure
Ploss: Power added by external loss distributions
Pcond: Power lost by thermal conduction to PTC regions. If power is added through PTC regions this is a negative value.
Prad: Power lost by radiation
Pconv: Power lost by convection
The power-curve is the derivative of the energy-curve with respect to the time. This curve is created automatically.
Temperature0D
This folder stores all temperature curves vs. time on points previously defined with the Monitor at Point tool.
Heatflow
The Heatflow folder contains the heatflow curves vs. time for all temperature and heat sources on PTC objects. These curves are created automatically.
Temperature
The Temperature folder contains the temperature curves vs. time for all temperature and heat sources on PTC objects. These curves are created automatically.
2D/3D results
Temperature
The transient temperature distribution is a scalar 3D field which is recorded at times previously defined with a 3D Field Monitor. It can be evaluated also on a 2D cut-plane.
Heat Flow Density
The stationary heat flow is a 3D vector field, which is recorded at times previously defined with a 3D Field Monitor. This field type shows were heat is transferred inside a structure, it can be evaluated also on a 2D cut-plane.
CST微波工作室培训课程套装,专家讲解,视频教学,帮助您快速学习掌握CST设计应用
上一篇:CST2013: Drag and Drop
下一篇:CST2013: Exporting Results Overview
CST培训课程推荐详情>>
 最全面、最专业的CST微波工作室视频培训课程,可以帮助您从零开始,全面系统学习CST的设计应用【More..】
频道总排行
- CST2013: Mesh Problem Handling
- CST2013: Field Source Overview
- CST2013: Discrete Port Overview
- CST2013: Sources and Boundary C
- CST2013: Multipin Port Overview
- CST2013: Farfield Overview
- CST2013: Waveguide Port
- CST2013: Frequency Domain Solver
- CST2013: Import ODB++ Files
- CST2013: Settings for Floquet B