- 易迪拓培训,专注于微波、射频、天线设计工程师的培养
CST2013: General / Load 1D Data File (project and external)
Post Processing: Result Templates Template Based Post Processing
By using this template, you are able to load any data into the template system, even if the comfortable way with a separate dialogue is not available. You can browse any file (project or external), thus being able to define watches and goals based on them.
Current project / external file
External file: Loads any file that represents tabulated ASCII values.
Current project: Load any file that is displayed in the 1D Results folder of the current project.
1D Data follows hereby the following naming convention: project_name^curve_name.extension
The project_name is similar for all files belonging to one project. The curve_name is typically a combination curve type (e.g. amplitude or phase) and the element name (e.g. lumped element or material name).
The type of the plot is represented by the following letters:
i - incoming port signal (in time domain)
o - outgoing port signal (in time domain)
s - general time signal
a - amplitude of a spectral value (e.g. S-parameter)
d - logarithmic amplitude of a spectral value (in dB)
p - phase of a spectral value
If currents and voltages are recorded in discrete ports or lumped elements the letters i u and z additionally mark if it is a current, voltage or impedance quantity respectively.
In case of a multi port and multi mode simulation the numbers in brackets assign the port mode, the number in front of the bracket the port number. Typical examples will be listed below.
Most data files have the file extension *.sig. Exceptions are listed below:
*.sig general 1D curve
*.bil sqrt(power) balance at the ports versus frequency
*.eng energy curve versus time
*.prs time signal of a probe
*.pra amplitude of a probe spectrum
*.prd amplitude of a probe spectrum in dB
*.prp phase of a probe spectrum
Please take a look in the following examples to get more details for the different file names, to be loaded.
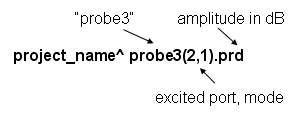
Example 1: Amplitude of a probe spectrum in dB

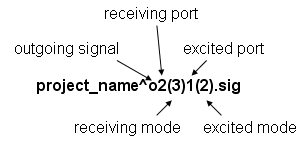
Example 2: Time domain port signal

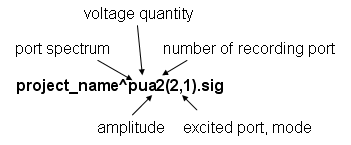
Example 3: Spectrum of the monitored voltage in a discrete port

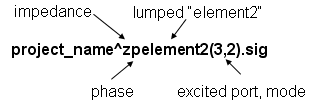
Example 4: Impedance of a lumped element over frequency

Example: Optimization to given external goal-curve.
Once you are interested in optimizing your device to match a given Goal-Curve (1D), which exists on disk in the form of an ASCII-table, you can link this curve as external file to the project and afterwards calculate the difference of both results (e.g. abs(current-goal)). The Mix1D Template (1D / + Mix 1D Results) can be considered for this. An integration of this difference would then define the 0D Result which is used as to be minimized during the optimization process. (0D / + 0D Value from 1D Result)
OK
This button completes the setup of the template. The new entry will be added to the list of templates which are executed automatically after each run. The default name of the template is set according to the settings, as long the name has not been changed manually.
Cancel
Aborts the setup of the template and closes this dialog box without performing any further action.
Help
Shows this help text.
CST微波工作室培训课程套装,专家讲解,视频教学,帮助您快速学习掌握CST设计应用
上一篇:CST2013: TDR (Time Domain Reflectometry)
下一篇:CST2013: 1D / VSWR
 最全面、最专业的CST微波工作室视频培训课程,可以帮助您从零开始,全面系统学习CST的设计应用【More..】
频道总排行
- CST2013: Mesh Problem Handling
- CST2013: Field Source Overview
- CST2013: Discrete Port Overview
- CST2013: Sources and Boundary C
- CST2013: Multipin Port Overview
- CST2013: Farfield Overview
- CST2013: Waveguide Port
- CST2013: Frequency Domain Solver
- CST2013: Import ODB++ Files
- CST2013: Settings for Floquet B
