- 易迪拓培训,专注于微波、射频、天线设计工程师的培养
HFSS15: Adding Datasets
录入:edatop.com 点击:
Datasets are collections of plotted data points that can be extrapolated into an equation based on the piecewise linear makeup of the plot. Each plot consists of straight line segments whose vertices represent their end points. A curve is fitted to the segments of the plot and an expression is derived from the curve that best fits the segmented plot. The created expression is then used in piecewise linear intrinsic functions. You can add datasets at either the Project Level or the Design level. They can be for various purposes, including to define frequency dependent port impedances or frequency dependent global variables, and boundary definitions.
Design level datasets can be used in geometry entities like part commands, coordinate systems, points, and planes. Datasets do not work wiht equation based surfaces or curves. Datasets can be used in directly with piecewise inear functions in expressions or indirectly through variables that can refer to the dataset. Datasets can be used in the following operations.
• Creation or edit of geometry.
When a geometry uses a dataset directly, edit dataset invalidates the solution. When a geometry uses a variable that is defined by dataset, edit dataset does not invalidate the solution.
• Animation based on a variable which can index in datasets.
• Copy/paste of geometry. If a part refers to a design dataset, it will be pasted to destination design.
1. For a Project level dataset, click Project>Datasets. For a Design level dataset, click HFSS> or HFSS-IE>Design Datasets.
The Datasets dialog box appears. This lists any existing datasets for the Project or Design level, respectively.
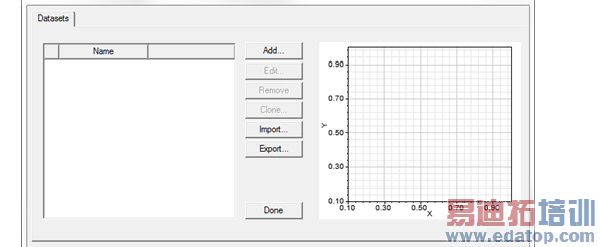
2. Click Add.
The Add Dataset dialog box appears.
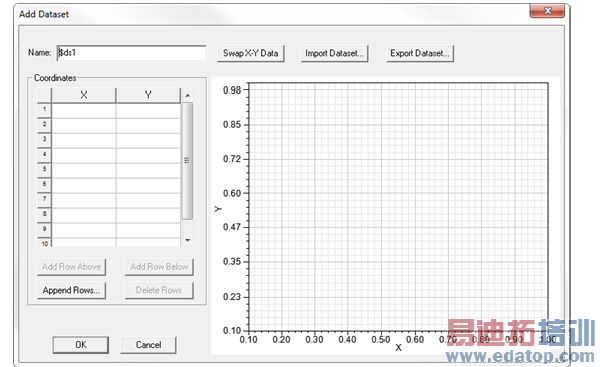
The dialog contains fields for the Dataset name, and a table for x- and y- coordinates. It contains a graphic display that draws a line for the coordinates you add. It also includes buttons for the following functions:
• Swap X-Y Data - this swaps the x- and Y- coordinates and adjusts the graphical display.
• Import Dataset - this provides a way to import data sets from an external source. The format is a tab separated points file. Clicking the button opens a file browser window.
• Export Dataset -- this provides a way to export the current dataset to a tab separated points file. Clicking the button opens a file browser window.
• Add Row Above - adds a new row to the table above the selected row.
• Add Row Below - adds a new row to the table below the selected row/
• Append Row - opens a dialog that lets you specify a number of rows to add to the table.
• Delete Row - deletes the selected row or rows.
3. Optionally, type a name other than the default for the dataset in the Name text box.
4. Enter the x- and y- coordinates by one of the following methods
• Import Dataset
• Type the x- and y-coordinates for the first data point in the row labeled 1.Type the x- and y-coordinates for the remaining data points in the dataset using the same method.
After you type a point’s coordinates and move to the next row, the point is added to the plot, adjusting the display with each newly entered point.
5. When you are finished entering the data point coordinates, click OK.
The dataset plot is extrapolated into an expression that can be used in parametric analyses, boundary definitions, or assigned to a material property value.
HFSS 学习培训课程套装,专家讲解,视频教学,帮助您全面系统地学习掌握HFSS
上一篇:Align Modes Using Integration Lines
下一篇:Align Selected Faces