- 易迪拓培训,专注于微波、射频、天线设计工程师的培养
HFSS15: Drawing an Equation-Based Curve
录入:edatop.com 点击:
Any line that can be described by an equation in three dimensions can be drawn.
1. Click Draw>Equation Based Curve ![]() .
.
The Equation Based Curve dialog box opens.
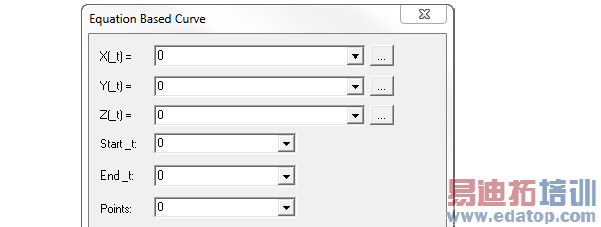
2. Type equations for X(_t), Y(_t), and Z(_t)
You can also define an equation by doing the following:
Click the ... button.
The Edit Equation dialog box appears.
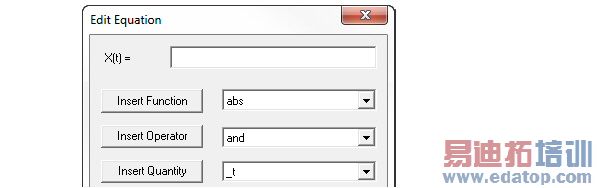
c. Do one or more of the following to define the equation:
Type a numerical value, variable, or expression directly in the text box.
Build an equation for X(_t), Y(_t), or Z(_t) by specifying appropriate trignometric function, operator, and quantity to insert from the corresponding pull-down lists.
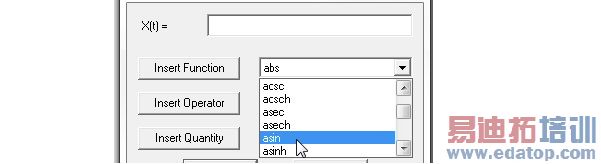
Select the respecting Insert Quantity, Operator or Quantity buttons to place the selections on the equation fields. An inserted Quanity goes inside a currently inserted Function.

You can also type operators and values to build complexequations.
d. When you are finished defining the equation, click OK to close the Edit Equation dialog box and return to the Equation Based Curve dialog box.
• Any unitless value input in equation based curve is taken as model units. For example, for Y(_t) = 1, the y value is taken as 1 model units (say mm). If a value has units, then it is converted to model units and used. For example, if we specify Y(_t) = 1cm, then y value will be correctly taken as 10mm.
• While parsing expressions, equation based curves convert each variable separately to model units and assume that the resulting expression is in model units.
• Equation based curvess depend on the variable value library to correctly evaluate the units of expression.
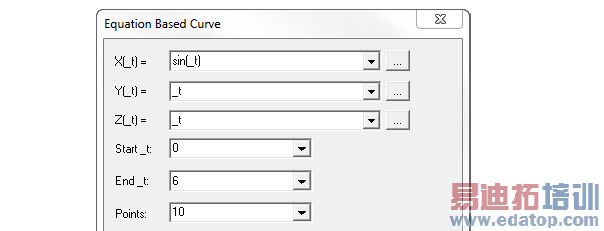
3. Select a start value from the Start_t pull-down list.
4. Select an end value from the End_t pull-down list.
5. Type in or select the number of points in the curve from the Points pull-down list.
6. Click OK on dialog to close it and create the curve.
The curve appears in the modeler window, and the History tree shows the curve object and the command.

If the Modeler option for editing properties of new primitives is checked, the Properties dialog box appears, in which you can modify the object’s attributes by editing the Properties.
The Properties listed as line attributes include Name, Orientation, whether a Model object, whether to Display Wireframe, Color, Transparency, and whether to Show Direction as arrows. The Show Direction property is most helpful to unambiguously show the line start orientation when plotting fields along a line.
HFSS 学习培训课程套装,专家讲解,视频教学,帮助您全面系统地学习掌握HFSS
上一篇:Distributed Memory Solutions with HFSS
下一篇:Download From Server